
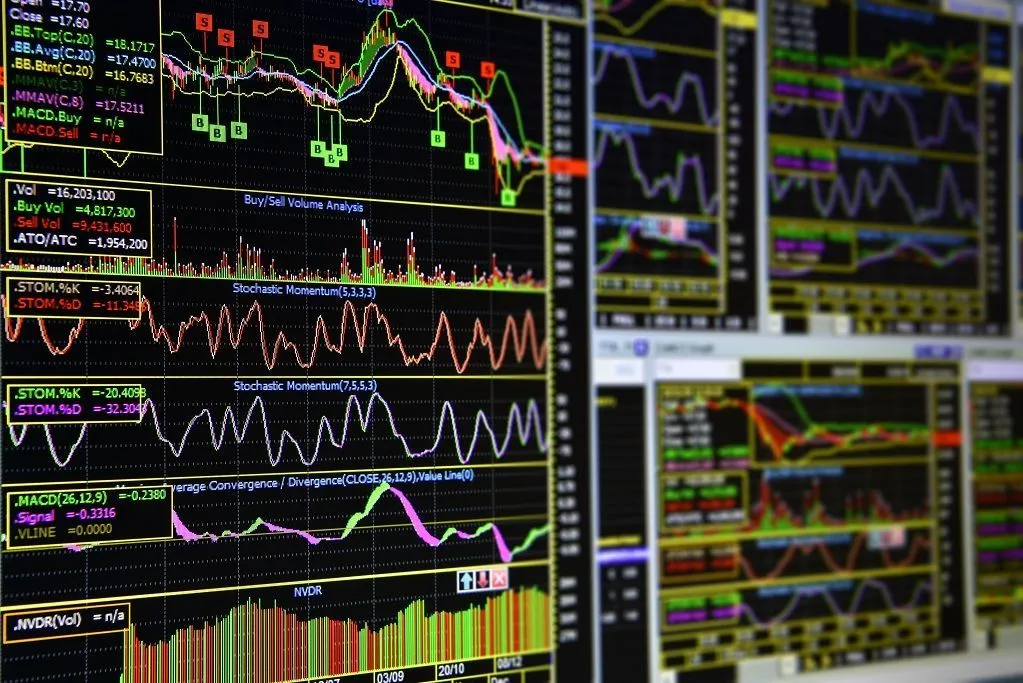
In the fast-paced world of trading, mastering the use of indicators can be a game-changer for any investor. Trading indicators are essential tools that help traders make informed decisions by analyzing market trends and predicting future price movements. Understanding how to effectively utilize these indicators can significantly enhance the success rate of investments. This article explores various trading indicators, their applications, and how integrating them into a trading strategy can lead to successful investments.
Understanding Trading Indicators
Trading indicators are statistical tools used to interpret financial data, offering insights into market trends. They can be broadly categorized into two types:
- Lagging Indicators: These indicators provide signals based on historical data, helping to confirm trends. Examples include Moving Averages and MACD (Moving Average Convergence Divergence).
- Leading Indicators: These indicators predict future market movements, providing signals before a trend starts. Examples include RSI (Relative Strength Index) and Stochastic Oscillator.
Moving Averages and Trend Confirmation
Moving averages are among the most reliable lagging indicators. They smooth out price data to identify the direction of the trend over a specified period. The two most common types are:
- Simple Moving Average (SMA): Calculated by averaging the prices over a set number of periods.
- Exponential Moving Average (EMA): Gives more weight to recent prices, reacting more quickly to price changes.
These averages help traders identify potential entry and exit points. Discover expert strategies here to optimize their use.
Leading Indicators for Market Prediction
Leading indicators are pivotal for traders aiming to anticipate market movements before they occur. Two widely used leading indicators are:
Relative Strength Index (RSI)
The RSI is a momentum oscillator that measures the speed and change of price movements. It ranges from 0 to 100, with levels above 70 indicating overbought conditions and levels below 30 indicating oversold conditions. Traders use the RSI to identify potential reversal points. Explore advanced guides and tips on leveraging RSI effectively.
Stochastic Oscillator
This indicator compares a particular closing price of a security to its price range over a specific period. It helps traders identify potential reversal points by indicating when a security is overbought or oversold. The stochastic oscillator is particularly useful in range-bound markets. Learn about our tailored solutions for employing this indicator in your strategy.
Combining Indicators for Enhanced Accuracy
While each indicator provides valuable insights, combining them can enhance accuracy and increase the likelihood of successful trades. For instance:
- Using a moving average to confirm a trend identified by the RSI.
- Pairing the stochastic oscillator with MACD to validate potential trend reversals.
Such combinations allow traders to cross-verify signals, reducing the risk of false predictions. Find out more about this approach to strategic indicator combination.
Conclusion
Mastering trading indicators is a vital component of any successful trading strategy. By understanding the roles of both lagging and leading indicators, traders can make informed decisions, improve the accuracy of their predictions, and optimize their investment outcomes. Consistent learning and practice are essential for mastering these tools, paving the way for successful investments. For further insights and resources on mastering trading indicators, explore advanced guides and tips available online.
